The epidemics of obesity and type 2 diabetes are affecting most if not all developed countries around the world. An analysis published in The Lancet showed that the number of patients with type 2 diabetes almost quadrupled since 1980. While the percentage of overweight or obese people is highest in North America and Europe, obesity rates are increasing at a stunning pace in developing countries. Small but steady societal changes over the past 50 years have slowly phased physical activity out of the lives of at least one third of the population. This increase in sedentary time combined with the increasing availability and consumption of highly palatable processed foods largely account for the expanding waist girths of the population around the globe. On top of eating habits, drinking habits also need to be held accountable for the health hazards of poor lifestyle habits. Indeed, energy-dense sugar-sweetened beverages (SSBs) are among the most consistent and significant dietary items that have systematically been found to be associated with obesity and type 2 diabetes rates in large epidemiological studies. For instance, a meta-analysis of studies on SSBs that included more than 300,000 individuals showed that compared to individuals who consume little or no SSBs, those who consume at least one per day have a 26% increased risk of developing type 2 diabetes.
Similar to the prevalence of obesity and type 2 diabetes, the chronic overconsumption of SSBs is also skyrocketing in many countries, although with a marked heterogeneity across countries. For instance, while countries of the developing world have seen an increase in SSB consumption, a decrease of SSB consumption has been noted in other regions of the world such as North America and Europe.
In order to monitor these changes across different countries and to raise awareness about the detrimental health consequences of chronic overconsumption of SSBs, the International Chair on Cardiometabolic Risk (ICCR) launched the ICCR Global SSB Sale Barometer. This barometer monitors SSB sales around the world as well as a 5-year (2010-2015) trend in SSB sales. I have had the privilege to present our main findings at the European Atherosclerosis Society Annual Meeting in Innsbruck, Austria.
To compare SSB sales in different countries around the world, we used data from the Euromonitor Passport International Database, which is a global market research database that provides data and analysis on everything from total market sizes, market shares, and industry trends to specific subcategory level information, including soft drinks. SSB sales represent the sum of on-trade (bars, cafés, restaurants, etc.) and off-trade (grocery stores, independent retailers, etc.) sales. The term “SSBs” includes caloric soft drinks, lemonade/lime carbonates, ginger ale, tonic water, orange carbonates, iced tea, juice drinks, sports drinks and energy drinks. Just as other reports on the subject such as the one by Popkin and Hawkes, also using data from the Euromonitor Passport International Database, and the one from the NutriCoDE group (which estimated the number of annual deaths attributable to SSBs at 184,000), we did not include 100% fruit juice sales as part of SSB sales.
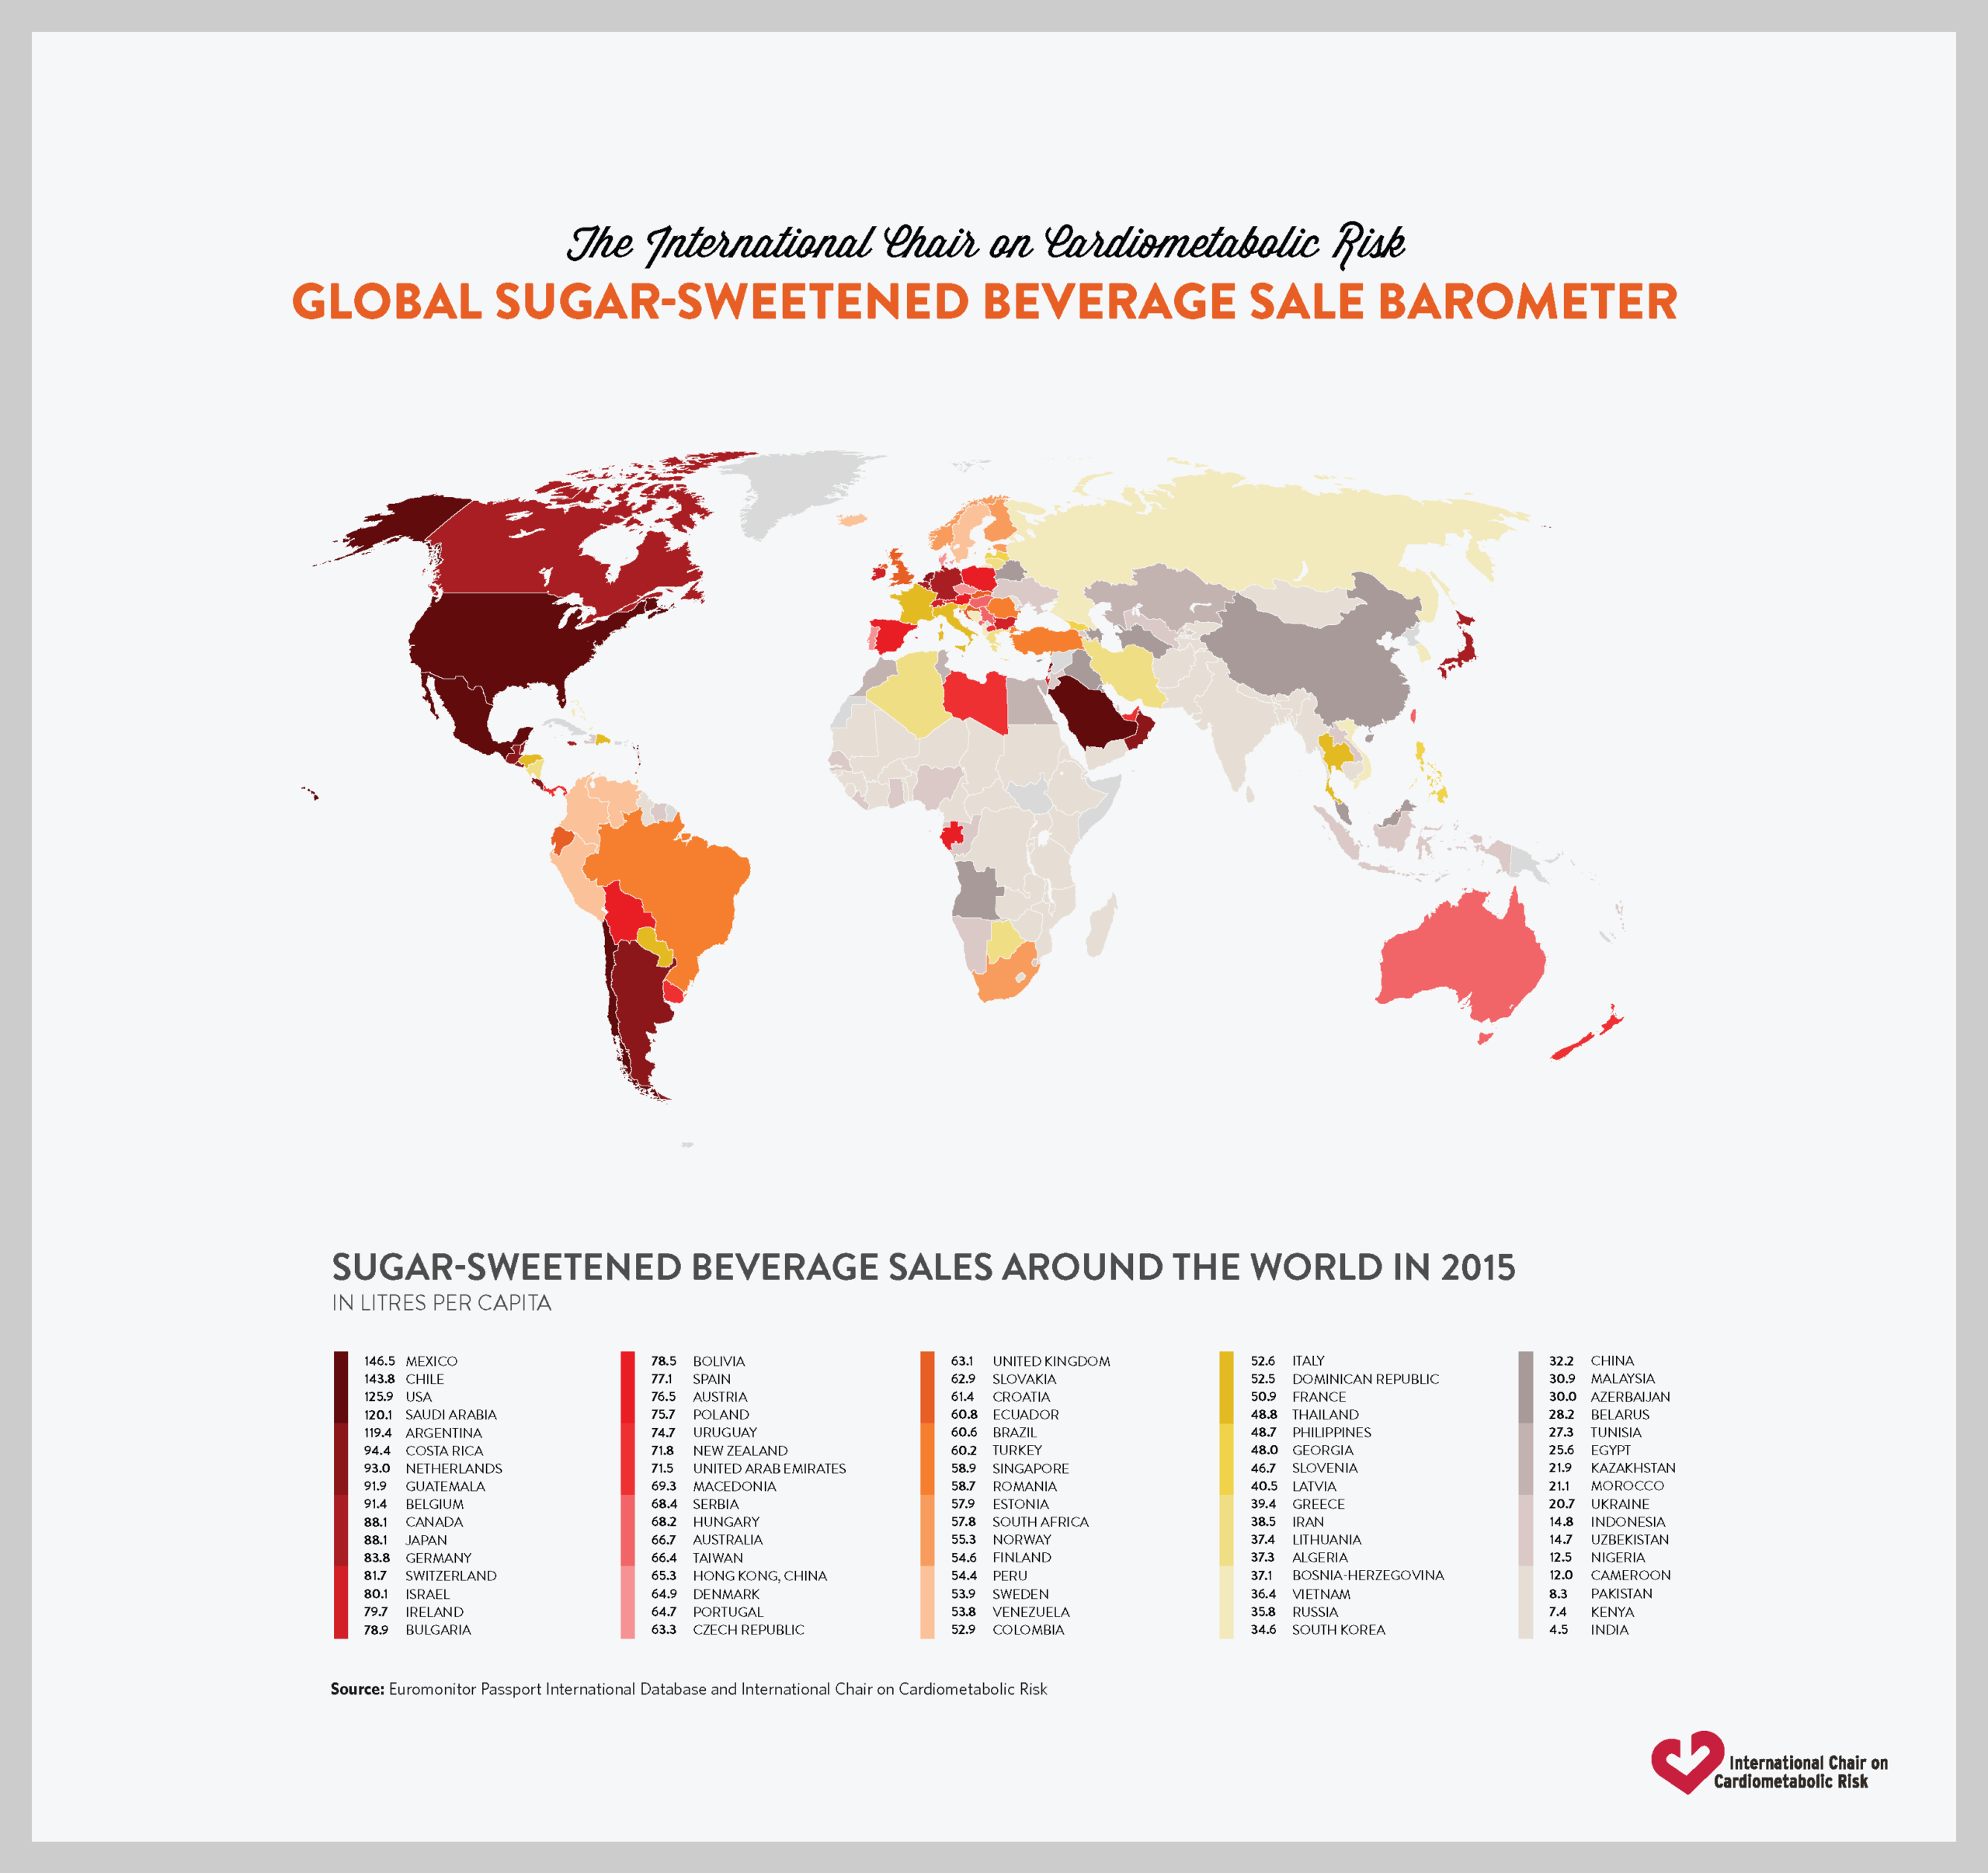
The main results of our analysis are presented in Figure 1. This map shows the data for 2015 total SSB sales (in litres per capita, LPC) in 181 countries. The Euromonitor Passport International Database actively researches and monitors trends in SSB sales in 80 countries. Data from other countries were modelled based on data imputed from the 80 researched countries (based on GDP, income inequalities, inbound tourism flows, etc.) and should therefore be interpreted with caution. Thus, data presented in the following Figures are from the 80 researched countries.
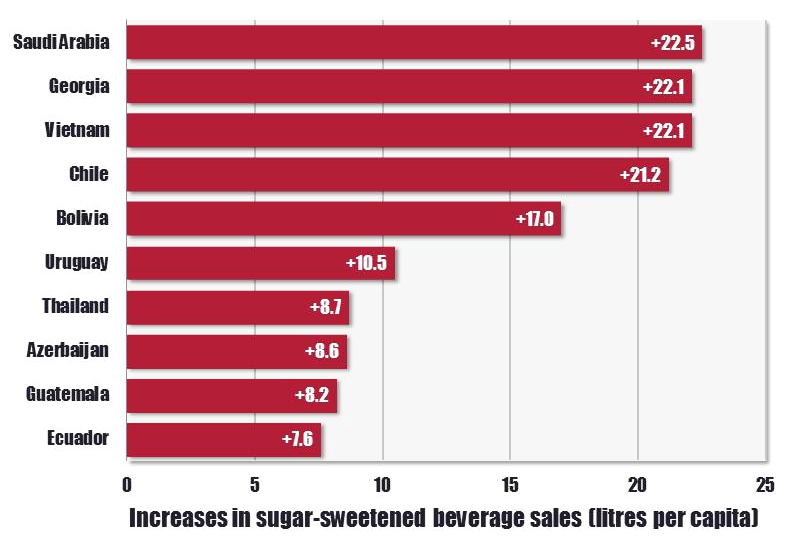
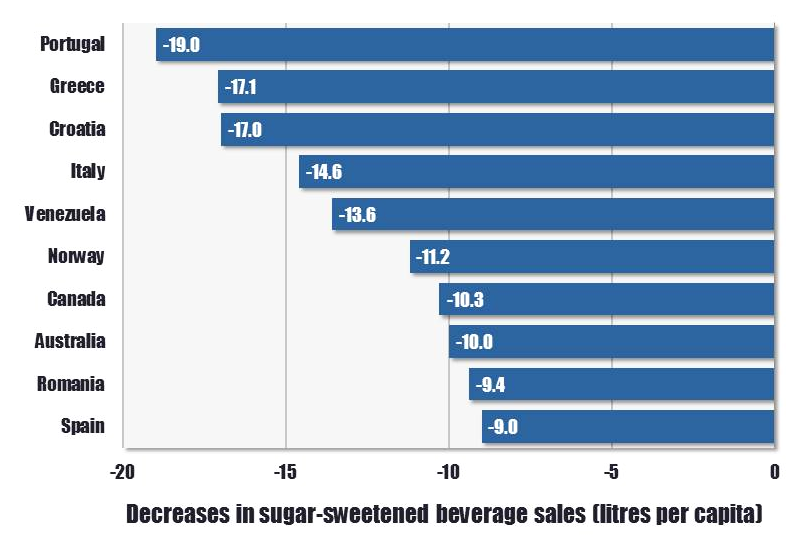
We were also interested in documenting changes in SSB sales that occurred between 2010 and 2015. Countries with the highest increases and decreases in SSB sales are shown in Figure 2A and 2B, respectively. Results show that certain countries such as Chile, Saudi Arabia, and Guatemala had a high progression of SSB sales in the last five years (Figure 2A) and are on top of the charts of SSB sales (Figure 1). However, while the 2015 sales in other countries like Vietnam, Georgia, Thailand, and Azerbaijan were not among the top (Figure 1), these countries were nevertheless among the top countries with the highest increases in SSB sales (Figure 2A). Countries with the highest decreases in SSB sales were mostly Western countries, with the exception of Venezuela, the latter being one of the only Latin countries with decreases in SSB sales (Figure 2B). These results show a marked heterogeneity in SSB sales throughout the world.
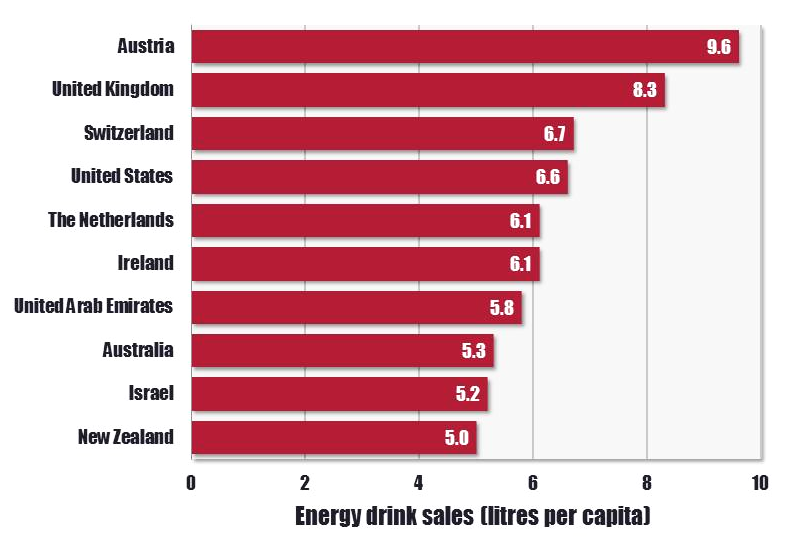
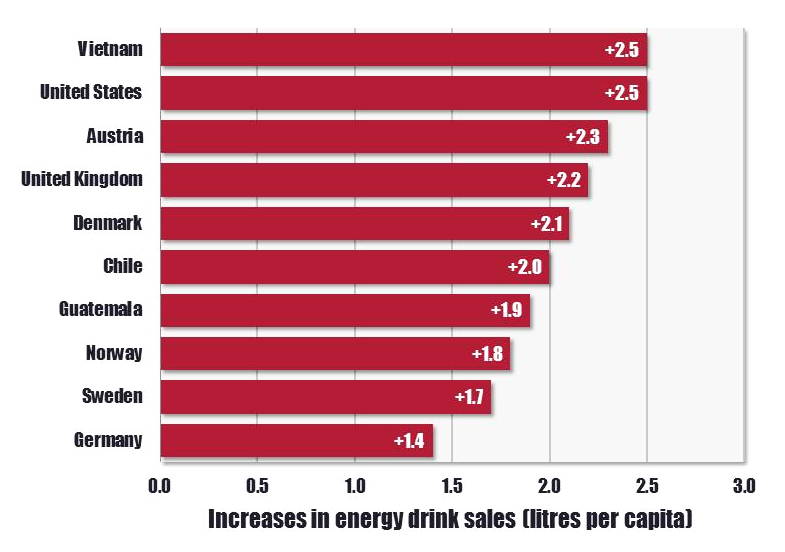
We also observed interesting trends in terms of energy drink sales. In 2015, energy drink sales represented only a minor fraction of total SSB sales. In fact, as shown in Figure 3, Austria was the country with the highest sales of energy drinks, and yet it accounted for less than 13% of the total SSB sales in that country. Energy drink sales are, however, on the rise in almost all countries around the world, except Ireland, Portugal, and Finland (Figure 4). Therefore, although total SSB sales are decreasing in many (mostly Western) countries, this decrease may be offset by an increase in energy drink sales.
In summary, results of the ICCR Global SSB Sale Barometer suggest that:
- There is a marked heterogeneity in drinking patterns around the world;
- Sugar-sweetened beverage sales are decreasing in North America and Western Europe;
- There is a significant increase in sugar-sweetened beverage sales in several emerging markets;
- Energy drink sales are on the rise almost everywhere.
Interestingly, although SSB sales seem to be decreasing in Western countries, obesity rates have remained fairly stable over this timeframe, which suggests that, although SSBs do contribute to our expanding waistline, public health efforts should continue to tackle both the SSB overconsumption and the overall consumption of ultra-processed, energy-dense foods with poor nutritional values. Furthermore, the decrease in SSB sales is offset in part by increases in energy drink sales, which are not less detrimental to human and public health.
It is quite sad to note that Western countries appeared to have exported such behaviours as overconsumption of SSBs in emerging markets. The substantial rise in SSB sales in these countries is disturbing. Let’s hope that it will continue to be monitored by public health authorities.