Computed Tomography (CT)
Evaluating CMR - Imaging TechniquesKey Points
- CT is a criterion method for assessing visceral fat.
- CT can also be used to measure ectopic fat in the liver and skeletal muscle.
- High cost and radiation exposure currently limit the routine use of this tool for assessing body composition and related health risk in clinical practice.
Determining Total Adiposity With Computed Tomography
There are a number of imaging techniques for determining total and regional body composition. Computed tomography (CT) and magnetic resonance imaging (MRI) provide cross-sectional images that can be used to determine total adiposity and are one of the most accurate tools available for directly quantifying body composition at a tissue level. As such, CT and MRI (discussed further in Magnetic Resonance Imaging) are often considered the criterion measures for assessing visceral fat and skeletal muscle in vivo. Other imaging techniques—such as dual energy x-ray absorptiometry (DEXA) and ultrasound—are also useful clinical imaging techniques for assessing total and visceral adiposity. The strengths and weaknesses of DEXA and ultrasonography are addressed in another section (see Other Imaging Techniques).
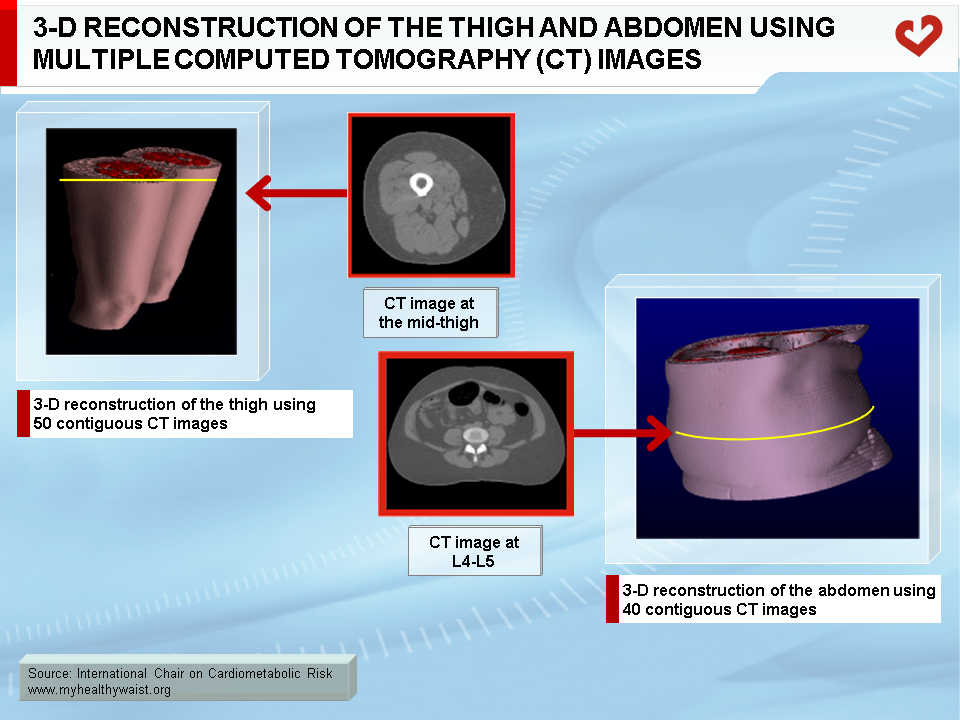
CT uses ionizing radiation and differences in tissue x-ray attenuation to produce cross-sectional images of the body [1, 2]. X-ray attenuation depends mainly on matter density and is commonly expressed in Hounsfield units (HU). Lower density tissues such as fat have lower HU ratings than higher density tissues such as muscle or bone. Cross-sectional CT images are composed of many pixels, each with a HU value reflecting the molecular composition of the tissue. Although CT is easier to use than MRI, radiation exposure makes it unsuitable for multiple-image whole body tissue quantification (Figure 1).
Determining Tissue Area or Mass Using CT
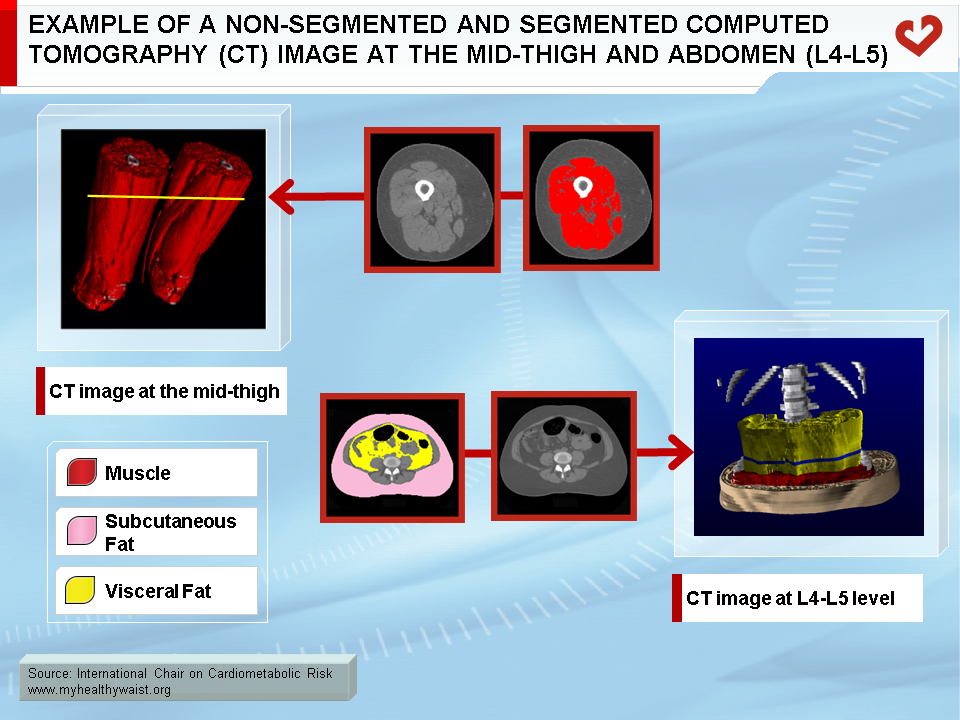
CT images are normally analyzed using one of two methods: 1) the perimeter of the tissue is traced manually and the area within the perimeter is calculated by multiplying the number of pixels in the region of interest by their known area, or 2) image segmentation algorithms are used to identify all pixels within a selected range of intensities (i.e., HU) believed to be representative of a specific tissue. The latter method is more common when assessing CT images.
Because of the radiation involved with CT, multiple CT images are generally not acquired. However, if multiple images are acquired, tissue volumes are calculated with the same methods used for MRI images [3-6]. They can then be converted to mass units by multiplying the volume by the assumed density values for that tissue [7,8].
Measuring Skeletal Muscle Mass Using CT
CT is one of the gold standard techniques used for in vivo quantification of skeletal muscle mass (Figure 2). Muscle mass and changes to it are related to muscle strength [9-11], and accurately determining skeletal muscle mass is particularly important in elderly populations, who are at increased risk of sarcopenia and functional impairment due to low muscle mass. Measures of skeletal muscle by a single CT image have been validated using cadaver measures and show a high level of agreement (R2=0.94, standard error of estimate=9.5%), with a coefficient of variation of approximately 2% [12]. When compared to cadaver values, CT error improved to approximately 1% when volume measures were acquired from multiple images. However, as CT involves radiation exposure, a single image at the mid-thigh is commonly used as a proxy measure of whole body skeletal muscle in both men and women (R2=0.77 to 0.79) [13].
Measuring Visceral Fat Using MRI and CT
MRI and CT are the only in vivo methods available to directly and accurately quantify visceral fat. Visceral fat is the fat located within the abdominal muscle wall that surrounds the organs (or viscera). On average, it accounts for only 12% and 5% of total body fat in men and women, respectively (Figure 3). As with skeletal muscle, measuring visceral fat with multiple images is costly, labour intensive, and in the case of CT, involves substantial radiation exposure. Consequently, visceral fat is normally assessed using a single MRI or CT image at L4-L5. However, it is important to note that visceral fat values obtained through CT are not necessarily comparable to those obtained through MRI [14,15].
There is a growing literature on the importance of visceral fat as a strong predictor of dyslipidemia [16-22], glucose tolerance [23,24], insulin resistance [24], and incidence of hypertension [18-20,25], cardiovascular disease [26], and type 2 diabetes [27]. Even within a given BMI category, men and women with greater amounts of visceral fat are more likely to be at increased risk of developing the metabolic syndrome [28], disturbances in glucose tolerance [29,30], and insulin resistance [29,31]. Further, prospective studies have indicated that visceral fat predicts future hypertension independent of age, BMI, weekly energy expenditure, systolic blood pressure, and glucose tolerance [25]. Similarly, visceral fat is a significant predictor of future type 2 diabetes independent of age, BMI, glucose intolerance, and family history [27]. It is not surprising, then, that visceral fat has also been linked to increased risk for all-cause mortality [32]. Accordingly, the International Atherosclerosis Society and the International Chair on Cardiometabolic Risk Working Group on Visceral Obesity has published a joint position statement emphasizing the importance of visceral adiposity and of ectopic fat depots and the risk of type 2 diabetes and cardiovascular disease [33].
Although excess visceral fat is increasingly recognized as a health hazard, there is little consensus as to optimal cutoffs for identifying individuals with excess visceral fat and therefore at increased health risk. Suggested cutoffs range from 100 to 130 cm2. Regardless of optimal cutoff values, an increase in visceral fat clearly worsens the metabolic profile, even among normal weight individuals [34]. Consequently, individuals should try to minimize visceral adiposity and avoid increases in visceral fat regardless of cutoff values. Moreover, because it is not possible to routinely measure visceral fat using MRI and CT, individuals should focus on routinely measuring waist circumference, which is the best surrogate measure currently available.

Measuring Ectopic Fat Using CT
CT can also be used to assess ectopic fat in the muscle and liver [35-38]. As measured by CT, liver fat infiltration is calculated by determining the attenuation values for each voxel within a region of interest in the liver. CT attenuation values depend on the molecular composition of the tissues within each voxel. Fat has a lower density than water and protein, and liver fat infiltration is reflected by a lower liver density and thus lower attenuation values [36]. However, normal and fatty liver values overlap [39]. As such, it has been suggested that liver density (CTL) should be expressed relative to the spleen attenuation value (CTS), which is not infiltrated with fat (Figure 4) [39]. In normal individuals, liver and spleen attenuation values have a constant relationship. The liver, however, is a denser organ and therefore has a higher attenuation value. A liver-to-spleen attenuation (CTL/CTS) ratio of less than one therefore indicates fatty infiltration [36,39]. Normally, the liver and spleen mean attenuation values are based on two or three regions of interest within the liver and spleen. However, due to the small area of interest and subjectivity involved in determining the regions of interest, the whole liver and spleen surface areas should be used to determine respective mean attenuation values (Figure 4) [40]. Attenuation values within the liver and spleen are fairly homogeneous throughout, and using the whole surface area can slightly reduce the inter-observer coefficient of variation from 5.1% [41] to 2.9% [40]. However, it is difficult to obtain a CT image that contains both liver and spleen. Not only does the spleen’s vertical position vary relative to the liver, both organs also vary in terms of their position within the abdominal cavity. As a multi-image approach is not feasible because of excess radiation exposure [42], a single axial image at the T12-L1 inter-vertebral space may be the best landmark for assessing both liver and spleen attenuation, given that liver and spleen can be identified at that level in approximately 90% of the men and women studied [40].
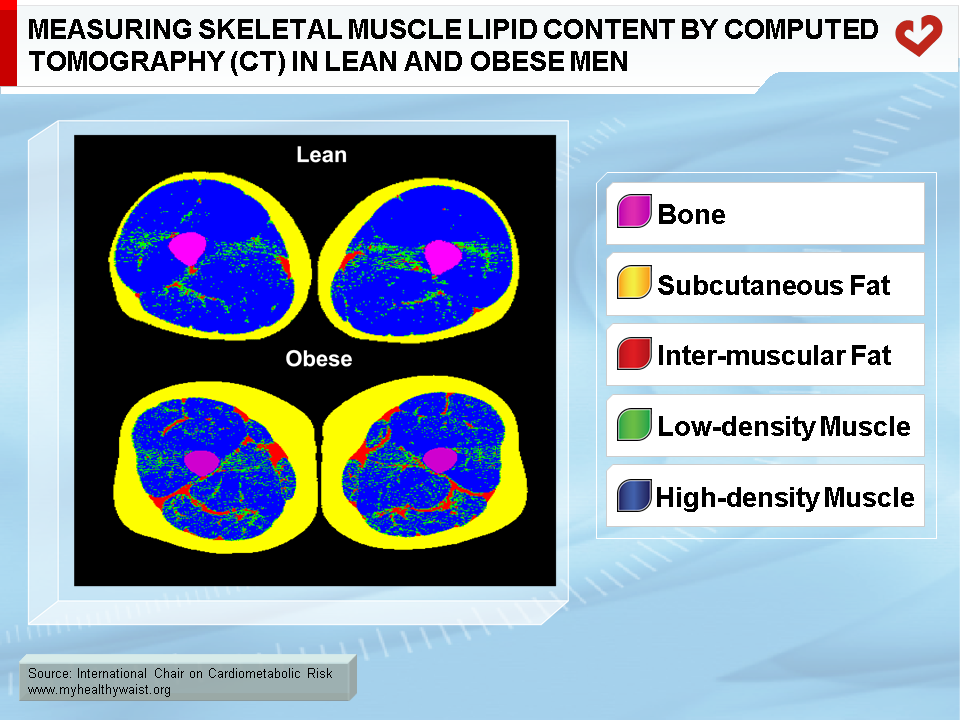
The average HU or mean attenuation value of adipose tissue-free skeletal muscle voxels can also be used as an index of skeletal muscle lipid content (Figure 5) [38]. As with the liver, the lower the skeletal muscle mean attenuation value or the greater the number of low-density skeletal muscle voxels (e.g., 0-30 HU), the higher the skeletal muscle lipid content. However, unlike the liver, fat is stored both inside and outside the muscle cell. As such, CT muscle attenuation values reflect both intra-myocellular (IMCL) and extra-myocellular (EMCL) lipid content. Although similar, they are not analogous to intra-myocellular lipid values obtained through skeletal muscle biopsy or proton magnetic resonance spectroscopy.
In summary, CT is one of the criterion methods for measuring visceral fat and skeletal muscle mass. It can also be used to assess lipid infiltration in tissues such as muscle and the liver. However, CT is expensive and involves radiation exposure, which limits the routine use of this tool for assessing body composition and predicting obesity-related health risk in clinical practice.

References
-
Heymsfield SB, Lohman TG, Wang Z and Going SB. Human Body Composition. Human Kinetics Press: Champaign, IL , 2005.
PubMed ID:
-
Bray GA, Bouchard C and James WPT. Handbook of Obesity. Marcel Dekker, Inc.: New York, NY, 1998.
PubMed ID:
-
Kvist H, Sjostrom L and Tylen U. Adipose tissue volume determinations in women by computed tomography: technical considerations. Int J Obes 1986; 10: 53-67.
PubMed ID: 3710689
-
Ross R, Rissanen J, Pedwell H, et al. Influence of diet and exercise on skeletal muscle and visceral adipose tissue in men. J Appl Physiol 1996; 81: 2445-55.
PubMed ID: 9018491
-
Ross R. Magnetic resonance imaging provides new insights into the characterization of adipose and lean tissue distribution. Can J Physiol Pharmacol 1996; 74: 778-85.
PubMed ID: 8909791
-
Shen W, Wang Z, Tang H, et al. Volume estimates by imaging methods: model comparisons with visible women as the reference. Obes Res 2003; 11: 217-25.
PubMed ID: 12582217
-
Snyder WS, Cooke MJ, Manssett ES, Larhansen LT, Howells GP and Tipton IH. Report of the Task Group on Reference Man. Pergamon: Oxford, UK, 1975.
PubMed ID:
-
Gallagher D, Belmonte D, Deurenberg P, et al. Organ-tissue mass measurement allows modeling of REE and metabolically active tissue mass. Am J Physiol 1998; 275: E249-58.
PubMed ID: 9688626
-
Hughes VA, Frontera WR, Wood M, et al. Longitudinal muscle strength changes in older adults: influence of muscle mass, physical activity, and health. J Gerontol A Biol Sci Med Sci 2001; 56: B209-17.
PubMed ID: 11320101
-
Newman AB, Haggerty CL, Goodpaster B, et al. Strength and muscle quality in a well-functioning cohort of older adults: the Health, Aging and Body Composition Study. J Am Geriatr Soc 2003; 51: 323-30.
PubMed ID: 12588575
-
Visser M, Goodpaster BH, Kritchevsky SB, et al. Muscle mass, muscle strength, and muscle fat infiltration as predictors of incident mobility limitations in well-functioning older persons. J Gerontol A Biol Sci Med Sci 2005; 60: 324-33.
PubMed ID: 15860469
-
Mitsiopoulos N, Baumgartner RN, Heymsfield SB, et al. Cadaver validation of skeletal muscle measurement by magnetic resonance imaging and computerized tomography. J Appl Physiol 1998; 85: 115-22.
PubMed ID: 9655763
-
Lee SJ, Janssen I, Heymsfield SB, et al. Relation between whole-body and regional measures of human skeletal muscle. Am J Clin Nutr 2004; 80: 1215-21.
PubMed ID: 15531668
-
Seidell JC, Bakker CJ and van der Kooy K. Imaging techniques for measuring adipose-tissue distribution–a comparison between computed tomography and 1.5-T magnetic resonance. Am J Clin Nutr 1990; 51: 953-7.
PubMed ID: 2349931
-
Ohsuzu F, Kosuda S, Takayama E, et al. Imaging techniques for measuring adipose-tissue distribution in the abdomen: a comparison between computed tomography and 1.5-tesla magnetic resonance spin-echo imaging. Radiat Med 1998; 16: 99-107.
PubMed ID: 9650896
-
Rennie K, McCarthy N, Yazdgerdi S, et al. Association of the metabolic syndrome with both vigorous and moderate physical activity. Int J Epidemiol 2003; 32: 600-6.
PubMed ID: 12913036
-
Ekelund U, Griffin SJ, Wareham NJ, et al. Physical Activity and Metabolic Risk in Individuals With a Family History of Type 2 Diabetes. Diabetes Care 2007; 30: 337-42.
PubMed ID: 17259504
-
Carroll S, Cooke CB, Butterly, et al. Metabolic clustering, physical activity and fitness in nonsmoking, middle-aged men. Med Sci Sports Exerc 2000; 32: 2079-86.
PubMed ID: 11128855
-
Lakka TA, Laaksonen DE, Lakka HM, et al. Sedentary lifestyle, poor cardiorespiratory fitness, and the metabolic syndrome. Med Sci Sports Exerc 2003; 35: 1279-86.
PubMed ID: 12900679
-
Thune I, Njolstad I, Lochen M-L, et al. Physical activity improves the metabolic risk profiles in men and women: The Tromsø Study. Arch Intern Med 1998; 158: 1633-40.
PubMed ID: 9701097
-
Lemieux I, Pascot A, Lamarche B, et al. Is the gender difference in LDL size explained by the metabolic complications of visceral obesity? Eur J Clin Invest 2002; 32: 909-17.
PubMed ID: 12534450
-
Kanaley JA, Sames C, Swisher L, et al. Abdominal fat distribution in pre- and postmenopausal women: The impact of physical activity, age, and menopausal status. Metabolism 2001; 50: 976-82.
PubMed ID: 11474488
-
Lemieux S, Prud’homme D, Nadeau A, et al. Seven-year changes in body fat and visceral adipose tissue in women. Association with indexes of plasma glucose-insulin homeostasis. Diabetes Care 1996; 19: 983-91.
PubMed ID: 8875093
-
Brochu M, Starling RD, Tchernof A, et al. Visceral adipose tissue is an independent correlate of glucose disposal in older obese postmenopausal women. J Clin Endocrinol Metab 2000; 85: 2378-84.
PubMed ID: 10902782
-
Hayashi T, Boyko EJ, Leonetti DL, et al. Visceral adiposity is an independent predictor of incident hypertension in Japanese Americans. Ann Intern Med 2004; 140: 992-1000.
PubMed ID: 15197016
-
Fujimoto WY, Bergstrom RW, Boyko EJ, et al. Visceral adiposity and incident coronary heart disease in Japanese-American men. The 10-year follow-up results of the Seattle Japanese-American Community Diabetes Study. Diabetes Care 1999; 22: 1808-12.
PubMed ID: 10546012
-
Boyko EJ, Fujimoto WY, Leonetti DL, et al. Visceral adiposity and risk of type 2 diabetes: a prospective study among Japanese Americans. Diabetes Care 2000; 23: 465-71.
PubMed ID: 10857936
-
Goodpaster BH, Krishnaswami S, Harris TB, et al. Obesity, regional body fat distribution, and the metabolic syndrome in older men and women. Arch Intern Med 2005; 165: 777-83.
PubMed ID: 15824297
-
Ross R, Aru J, Freeman J, et al. Abdominal adiposity and insulin resistance in obese men. Am J Physiol Endocrinol Metab 2002; 282: E657-63.
PubMed ID: 11832370
-
Pouliot MC, Després JP, Nadeau A, et al. Visceral obesity in men. Associations with glucose tolerance, plasma insulin, and lipoprotein levels. Diabetes 1992; 41: 826-34.
PubMed ID: 1612197
-
Ross R, Freeman J, Hudson R, et al. Abdominal obesity, muscle composition, and insulin resistance in premenopausal women. J Clin Endocrinol Metab 2002; 87: 5044-51.
PubMed ID: 12414870
-
Kuk JL, Katzmarzyk PT, Nichaman MZ, et al. Visceral fat is an independent predictor of all-cause mortality in men. Obes Res 2006; 14: 336-41.
PubMed ID: 16571861
-
Neeland IJ, Ross, R, Després JP, et al. Visceral and ectopic fat, atherosclerosis, and cardiometabolic disease: a position statement. Lancet Diabetes Endocrinol 2019; 7: 715-25.
PubMed ID: 31301983
-
Kuk JL, Nichaman MZ, Church TS, et al. Liver fat is not a marker of metabolic risk in lean premenopausal women. Metabolism 2004; 53: 1066-71.
PubMed ID: 15281020
-
Banerji MA, Buckley MC, Chaiken RL, et al. Liver fat, serum triglycerides and visceral adipose tissue in insulin-sensitive and insulin-resistant black men with NIDDM. Int J Obes Relat Metab Disord 1995; 19: 846-50.
PubMed ID: 8963350
-
Ricci C, Longo R, Gioulis E, et al. Noninvasive in vivo quantitative assessment of fat content in human liver. J Hepatol 1997; 27: 108-13.
PubMed ID: 9252082
-
Goto T, Onuma T, Takebe K, et al. The influence of fatty liver on insulin clearance and insulin resistance in non-diabetic Japanese subjects. Int J Obes Relat Metab Disord 1995; 19: 841-5.
PubMed ID: 8963349
-
Goodpaster BH, Kelley DE, Thaete FL, et al. Skeletal muscle attenuation determined by computed tomography is associated with skeletal muscle lipid content. J Appl Physiol 2000; 89: 104-10.
PubMed ID: 10904041
-
Piekarski J, Goldberg HI, Royal SA, et al. Difference between liver and spleen CT numbers in the normal adult: its usefulness in predicting the presence of diffuse liver disease. Radiology 1980; 137: 727-9.
PubMed ID: 6934563
-
Davidson LE, Kuk JL, Church TS, et al. Protocol for measurement of liver fat by computed tomography. J Appl Physiol 2006; 100: 864-8
PubMed ID: 16293702
-
Nguyen-Duy TB, Nichaman MZ, Church TS, et al. Visceral fat and liver fat are independent predictors of metabolic risk factors in men. Am J Physiol Endocrinol Metab 2003; 284: E1065-71.
PubMed ID: 12554597
-
Joy D, Thava VR and Scott BB. Diagnosis of fatty liver disease: is biopsy necessary? Eur J Gastroenterol Hepatol 2003; 15: 539-43.
PubMed ID: 12702913
 CLOSE
CLOSE
CLOSE
CLOSE
CLOSE
CLOSE
Kvist H, Sjostrom L and Tylen U. Adipose tissue volume determinations in women by computed tomography: technical considerations. Int J Obes 1986; 10: 53-67.
PubMed ID: 3710689CLOSE
Ross R, Rissanen J, Pedwell H, et al. Influence of diet and exercise on skeletal muscle and visceral adipose tissue in men. J Appl Physiol 1996; 81: 2445-55.
PubMed ID: 9018491CLOSE
Ross R. Magnetic resonance imaging provides new insights into the characterization of adipose and lean tissue distribution. Can J Physiol Pharmacol 1996; 74: 778-85.
PubMed ID: 8909791CLOSE
Shen W, Wang Z, Tang H, et al. Volume estimates by imaging methods: model comparisons with visible women as the reference. Obes Res 2003; 11: 217-25.
PubMed ID: 12582217CLOSE
CLOSE
Gallagher D, Belmonte D, Deurenberg P, et al. Organ-tissue mass measurement allows modeling of REE and metabolically active tissue mass. Am J Physiol 1998; 275: E249-58.
PubMed ID: 9688626CLOSE
Hughes VA, Frontera WR, Wood M, et al. Longitudinal muscle strength changes in older adults: influence of muscle mass, physical activity, and health. J Gerontol A Biol Sci Med Sci 2001; 56: B209-17.
PubMed ID: 11320101CLOSE
Newman AB, Haggerty CL, Goodpaster B, et al. Strength and muscle quality in a well-functioning cohort of older adults: the Health, Aging and Body Composition Study. J Am Geriatr Soc 2003; 51: 323-30.
PubMed ID: 12588575CLOSE
Visser M, Goodpaster BH, Kritchevsky SB, et al. Muscle mass, muscle strength, and muscle fat infiltration as predictors of incident mobility limitations in well-functioning older persons. J Gerontol A Biol Sci Med Sci 2005; 60: 324-33.
PubMed ID: 15860469CLOSE
Mitsiopoulos N, Baumgartner RN, Heymsfield SB, et al. Cadaver validation of skeletal muscle measurement by magnetic resonance imaging and computerized tomography. J Appl Physiol 1998; 85: 115-22.
PubMed ID: 9655763CLOSE
Lee SJ, Janssen I, Heymsfield SB, et al. Relation between whole-body and regional measures of human skeletal muscle. Am J Clin Nutr 2004; 80: 1215-21.
PubMed ID: 15531668CLOSE
Seidell JC, Bakker CJ and van der Kooy K. Imaging techniques for measuring adipose-tissue distribution–a comparison between computed tomography and 1.5-T magnetic resonance. Am J Clin Nutr 1990; 51: 953-7.
PubMed ID: 2349931CLOSE
Ohsuzu F, Kosuda S, Takayama E, et al. Imaging techniques for measuring adipose-tissue distribution in the abdomen: a comparison between computed tomography and 1.5-tesla magnetic resonance spin-echo imaging. Radiat Med 1998; 16: 99-107.
PubMed ID: 9650896CLOSE
Rennie K, McCarthy N, Yazdgerdi S, et al. Association of the metabolic syndrome with both vigorous and moderate physical activity. Int J Epidemiol 2003; 32: 600-6.
PubMed ID: 12913036CLOSE
Ekelund U, Griffin SJ, Wareham NJ, et al. Physical Activity and Metabolic Risk in Individuals With a Family History of Type 2 Diabetes. Diabetes Care 2007; 30: 337-42.
PubMed ID: 17259504CLOSE
Carroll S, Cooke CB, Butterly, et al. Metabolic clustering, physical activity and fitness in nonsmoking, middle-aged men. Med Sci Sports Exerc 2000; 32: 2079-86.
PubMed ID: 11128855CLOSE
Lakka TA, Laaksonen DE, Lakka HM, et al. Sedentary lifestyle, poor cardiorespiratory fitness, and the metabolic syndrome. Med Sci Sports Exerc 2003; 35: 1279-86.
PubMed ID: 12900679CLOSE
Thune I, Njolstad I, Lochen M-L, et al. Physical activity improves the metabolic risk profiles in men and women: The Tromsø Study. Arch Intern Med 1998; 158: 1633-40.
PubMed ID: 9701097CLOSE
Lemieux I, Pascot A, Lamarche B, et al. Is the gender difference in LDL size explained by the metabolic complications of visceral obesity? Eur J Clin Invest 2002; 32: 909-17.
PubMed ID: 12534450CLOSE
Kanaley JA, Sames C, Swisher L, et al. Abdominal fat distribution in pre- and postmenopausal women: The impact of physical activity, age, and menopausal status. Metabolism 2001; 50: 976-82.
PubMed ID: 11474488CLOSE
Lemieux S, Prud’homme D, Nadeau A, et al. Seven-year changes in body fat and visceral adipose tissue in women. Association with indexes of plasma glucose-insulin homeostasis. Diabetes Care 1996; 19: 983-91.
PubMed ID: 8875093CLOSE
Brochu M, Starling RD, Tchernof A, et al. Visceral adipose tissue is an independent correlate of glucose disposal in older obese postmenopausal women. J Clin Endocrinol Metab 2000; 85: 2378-84.
PubMed ID: 10902782CLOSE
Hayashi T, Boyko EJ, Leonetti DL, et al. Visceral adiposity is an independent predictor of incident hypertension in Japanese Americans. Ann Intern Med 2004; 140: 992-1000.
PubMed ID: 15197016CLOSE
Fujimoto WY, Bergstrom RW, Boyko EJ, et al. Visceral adiposity and incident coronary heart disease in Japanese-American men. The 10-year follow-up results of the Seattle Japanese-American Community Diabetes Study. Diabetes Care 1999; 22: 1808-12.
PubMed ID: 10546012CLOSE
Boyko EJ, Fujimoto WY, Leonetti DL, et al. Visceral adiposity and risk of type 2 diabetes: a prospective study among Japanese Americans. Diabetes Care 2000; 23: 465-71.
PubMed ID: 10857936CLOSE
Goodpaster BH, Krishnaswami S, Harris TB, et al. Obesity, regional body fat distribution, and the metabolic syndrome in older men and women. Arch Intern Med 2005; 165: 777-83.
PubMed ID: 15824297CLOSE
Ross R, Aru J, Freeman J, et al. Abdominal adiposity and insulin resistance in obese men. Am J Physiol Endocrinol Metab 2002; 282: E657-63.
PubMed ID: 11832370CLOSE
Pouliot MC, Després JP, Nadeau A, et al. Visceral obesity in men. Associations with glucose tolerance, plasma insulin, and lipoprotein levels. Diabetes 1992; 41: 826-34.
PubMed ID: 1612197CLOSE
Ross R, Freeman J, Hudson R, et al. Abdominal obesity, muscle composition, and insulin resistance in premenopausal women. J Clin Endocrinol Metab 2002; 87: 5044-51.
PubMed ID: 12414870CLOSE
Kuk JL, Katzmarzyk PT, Nichaman MZ, et al. Visceral fat is an independent predictor of all-cause mortality in men. Obes Res 2006; 14: 336-41.
PubMed ID: 16571861CLOSE
Neeland IJ, Ross, R, Després JP, et al. Visceral and ectopic fat, atherosclerosis, and cardiometabolic disease: a position statement. Lancet Diabetes Endocrinol 2019; 7: 715-25.
PubMed ID: 31301983CLOSE
Kuk JL, Nichaman MZ, Church TS, et al. Liver fat is not a marker of metabolic risk in lean premenopausal women. Metabolism 2004; 53: 1066-71.
PubMed ID: 15281020CLOSE
Banerji MA, Buckley MC, Chaiken RL, et al. Liver fat, serum triglycerides and visceral adipose tissue in insulin-sensitive and insulin-resistant black men with NIDDM. Int J Obes Relat Metab Disord 1995; 19: 846-50.
PubMed ID: 8963350CLOSE
Ricci C, Longo R, Gioulis E, et al. Noninvasive in vivo quantitative assessment of fat content in human liver. J Hepatol 1997; 27: 108-13.
PubMed ID: 9252082CLOSE
Goto T, Onuma T, Takebe K, et al. The influence of fatty liver on insulin clearance and insulin resistance in non-diabetic Japanese subjects. Int J Obes Relat Metab Disord 1995; 19: 841-5.
PubMed ID: 8963349CLOSE
Goodpaster BH, Kelley DE, Thaete FL, et al. Skeletal muscle attenuation determined by computed tomography is associated with skeletal muscle lipid content. J Appl Physiol 2000; 89: 104-10.
PubMed ID: 10904041CLOSE
Piekarski J, Goldberg HI, Royal SA, et al. Difference between liver and spleen CT numbers in the normal adult: its usefulness in predicting the presence of diffuse liver disease. Radiology 1980; 137: 727-9.
PubMed ID: 6934563CLOSE
Davidson LE, Kuk JL, Church TS, et al. Protocol for measurement of liver fat by computed tomography. J Appl Physiol 2006; 100: 864-8
PubMed ID: 16293702CLOSE
Nguyen-Duy TB, Nichaman MZ, Church TS, et al. Visceral fat and liver fat are independent predictors of metabolic risk factors in men. Am J Physiol Endocrinol Metab 2003; 284: E1065-71.
PubMed ID: 12554597CLOSE
Joy D, Thava VR and Scott BB. Diagnosis of fatty liver disease: is biopsy necessary? Eur J Gastroenterol Hepatol 2003; 15: 539-43.
PubMed ID: 12702913