Magnetic Resonance Imaging (MRI)
Evaluating CMR - Imaging TechniquesKey Points
- MRI is a criterion method for assessing visceral fat.
- MRI can be used to measure ectopic fat deposition in the liver and skeletal muscle.
- High cost and limited availability currently hinder the routine use of this tool for assessing body composition and related health risk in clinical practice.
Imaging Techniques
There are several imaging techniques for determining total and regional body composition. Magnetic resonance imaging (MRI) provides cross-sectional images that can be used to determine total adiposity and are one of the most accurate tools available for quantifying body composition at a tissue level. Along with Computed Tomography (CT), MRI is often considered the criterion measure for assessing visceral fat and skeletal muscle in vivo. Other imaging techniques such as dual energy x-ray absorptiometry (DEXA) and ultrasound are also useful clinical techniques for assessing total and visceral adiposity. The strengths and weaknesses of DEXA and ultrasonography are addressed in the Other Imaging Techniques section.
Magnetic Resonance Imaging: How it Works
MRI uses the interaction between strong magnetic fields and hydrogen nuclei (protons)—which are abundant in all biological tissues—to create cross-sectional images of the body [1,2]. Unlike CT, MRI is not known to have any adverse side effects and is therefore the preferred method for assessing whole body tissue composition. However, MRI takes much longer to acquire images, and analyzing these images is a more complex and time-consuming process. Using multiple images acquired with standard clinical magnets (e.g., 1.5 or 3.0 Tesla), whole body MRI data for fat and lean mass can be acquired in about 45 minutes (Figure 1) [3-5].

Determining Tissue Area or Mass
MRI images are normally analyzed using one of two methods: 1) the perimeter of the tissue of interest is traced manually [6,7], and the area within the perimeter is calculated by multiplying the number of pixels in the region of interest by their known area, or 2) image segmentation algorithms are used to identify all pixels within a selected range of intensities believed to be representative of a specific tissue. However, the latter approach is considered more problematic when applied to MRI images for three reasons: 1) distributions of pixel intensity (greyscale) values for different tissues overlap more for MRI than for CT images, 2) noise due to respiratory motion blurs the borders between tissues in the abdomen to a greater extent in MRI than in CT, and 3) inhomogeneity in the magnetic field can produce shading at the peripheries of MRI images [6].
With multiple MRI images, tissue volumes can be calculated by integrating cross-sectional area data from consecutive images. Because of the cost of image acquisition and analysis, images are typically collected with gaps between images (usually ranging from 20 to 40 mm), and volumes are then calculated using various modeling equations [3,4,8,9]. Tissue densities for adipose tissue, skeletal muscle, and organs are fairly constant from person to person, and volume measures for these tissues can be converted to mass units by multiplying the volume by assumed tissue density values [10,11].
Measuring Skeletal Muscle Mass
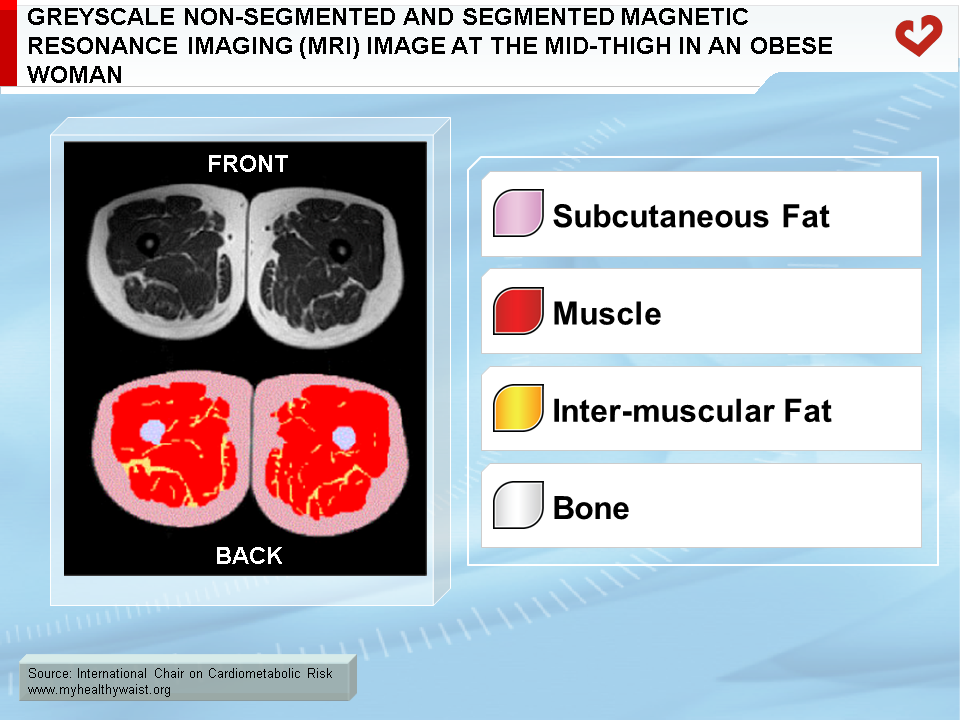
MRI and CT are the gold standard measures for in vivo quantification of skeletal muscle mass (Figure 2). Muscle mass and changes to it are related to muscle strength [12-14], and accurately determining skeletal muscle mass is particularly important in elderly populations who are at increased risk of sarcopenia and functional impairment due to low muscle mass. Measures of skeletal muscle by a single MRI image have been validated using cadaver measures and show a high level of agreement (R2=0.94, standard error of estimate=10%) and a low coefficient of variation (CV~2%) [15]. Compared to cadaver values, MRI error improved to approximately 1% when volume measures were acquired using multiple images. However, as this is a very time-consuming and expensive process, a single image at the mid-thigh is commonly used as a proxy measure of whole body skeletal muscle in both men and women (R2=0.77-0.79) [16].
Measuring Visceral Fat
MRI and CT are the only in vivo methods available to directly and accurately quantify visceral fat. Visceral fat is the fat that is located within the abdominal muscle wall and that surrounds the organs (or viscera). On average, it accounts for only 12% and 5% of total body fat content in men and women respectively (See Figure 3 in Computed Tomography). As with skeletal muscle, it is costly and labour intensive to take measures of visceral fat using multiple images. Consequently, visceral fat is normally assessed using a single MRI or CT image at L4-L5 (Figure 3). However, due to differences between the methods, visceral fat values as determined by CT are not necessarily comparable to those determined by MRI [17,18].
As discussed in the Computed Tomography section, there is a growing literature demonstrating the importance of visceral fat as a strong predictor of numerous metabolic abnormalities [19-30]. Prospective studies have shown that visceral fat predicts future hypertension [28] and type 2 diabetes [30] independent of factors such as age, BMI, weekly energy expenditure, and metabolic risk factors. Visceral fat has also recently been reported to increase risk for all-cause mortality [31]. Given the harmful effects of visceral fat [32], individuals should take steps to reduce their visceral fat and ensure it does not increase. However, as it is not possible to routinely measure visceral fat using MRI and CT, emphasis should be placed on routine measurement of waist circumference, which is the best surrogate measure currently available [33].

Measuring Ectopic Fat Using MRI
MRI can also be used to assess ectopic fat deposition within the muscle and liver [34,35]. The Dixon method is most commonly used to measure fatty infiltration by MRI. In essence, the protons in fat and water produce different signals, which means the fat signal intensity of a given region relative to its water signal intensity can be used as a marker of lipid infiltration. Using this method, MRI cannot separate the lipid into its intra- and extra-cellular lipid compartments. This is not a concern in the liver as lipid exists only within the cell. In muscle, however, lipid exists both inside and outside the cell. This may be important as lipid accumulation can have different metabolic consequences depending on whether it is inside or outside the muscle cell. Nevertheless, MRI measures of lipid accumulation within the muscle and liver closely match skeletal muscle and liver intracellular lipid measures using criterion methods such as biopsy [35] or magnetic resonance spectroscopy [36,37].
MRI is one of the criterion methods for measuring visceral fat and skeletal muscle mass. It can also be used to assess lipid infiltration in tissues such as muscle and the liver. However, assessing body composition using MRI is an expensive, time-consuming, and labour-intensive process. In addition, MRI’s limited availability hinders the routine use of this tool for assessing body composition and predicting obesity-related health risk in clinical practice.
References
-
Heymsfield SB, Lohman TG, Wang Z and Going SB. Human Body Composition. Human Kinetics Press: Champaign, IL , 2005.
PubMed ID:
-
Ross R, Goodpaster B, Kelley D, et al. Magnetic resonance imaging in human body composition research. From quantitative to qualitative tissue measurement. Ann N Y Acad Sci 2000; 904: 12-7.
PubMed ID: 10865704
-
Ross R, Rissanen J, Pedwell H, et al. Influence of diet and exercise on skeletal muscle and visceral adipose tissue in men. J Appl Physiol 1996; 81: 2445-55.
PubMed ID: 9018491
-
Ross R. Magnetic resonance imaging provides new insights into the characterization of adipose and lean tissue distribution. Can J Physiol Pharmacol 1996; 74: 778-85.
PubMed ID: 8909791
-
Thomas EL, Saeed N, Hajnal JV, et al. Magnetic resonance imaging of total body fat. J Appl Physiol 1998; 85: 1778-85.
PubMed ID: 9804581
-
Ross R, Léger L, Morris D, et al. Quantification of adipose tissue by MRI: relationship with anthropometric variables. J Appl Physiol 1992; 72: 787-95.
PubMed ID: 1559959
-
Abate N, Burns D, Peshock RM, et al. Estimation of adipose tissue mass by magnetic resonance imaging: validation against dissection in human cadavers. J Lipid Res 1994; 35: 1490-6.
PubMed ID: 7989873
-
Kvist H, Sjostrom L and Tylen U. Adipose tissue volume determinations in women by computed tomography: technical considerations. Int J Obes 1986; 10: 53-67.
PubMed ID: 3710689
-
Shen W, Wang Z, Tang H, et al. Volume estimates by imaging methods: model comparisons with visible woman as the reference. Obes Res 2003; 11: 217-25.
PubMed ID: 12582217
-
Snyder WS, Cooke MJ, Manssett ES, Larhansen LT, Howells GP and Tipton IH. Report of the Task Group on Reference Man. Pergamon: Oxford, UK, 1975.
PubMed ID:
-
Gallagher D, Belmonte D, Deurenberg P, et al. Organ-tissue mass measurement allows modeling of REE and metabolically active tissue mass. Am J Physiol 1998; 275: E249-58.
PubMed ID: 9688626
-
Hughes VA, Frontera WR, Wood M, et al. Longitudinal muscle strength changes in older adults: influence of muscle mass, physical activity, and health. J Gerontol A Biol Sci Med Sci 2001; 56: B209-17.
PubMed ID: 11320101
-
Newman AB, Haggerty CL, Goodpaster B, et al. Strength and muscle quality in a well-functioning cohort of older adults: the Health, Aging and Body Composition Study. J Am Geriatr Soc 2003; 51: 323-30.
PubMed ID: 12588575
-
Visser M, Goodpaster BH, Kritchevsky SB, et al. Muscle mass, muscle strength, and muscle fat infiltration as predictors of incident mobility limitations in well-functioning older persons. J Gerontol A Biol Sci Med Sci 2005; 60: 324-33.
PubMed ID: 15860469
-
Mitsiopoulos N, Baumgartner RN, Heymsfield SB, et al. Cadaver validation of skeletal muscle measurement by magnetic resonance imaging and computerized tomography. J Appl Physiol 1998; 85: 115-22.
PubMed ID: 9655763
-
Lee SJ, Janssen I, Heymsfield SB, et al. Relation between whole-body and regional measures of human skeletal muscle. Am J Clin Nutr 2004; 80: 1215-21.
PubMed ID: 15531668
-
Seidell JC, Bakker CJ and van der Kooy K. Imaging techniques for measuring adipose-tissue distribution–a comparison between computed tomography and 1.5-T magnetic resonance. Am J Clin Nutr 1990; 51: 953-7.
PubMed ID: 2349931
-
Ohsuzu F, Kosuda S, Takayama E, et al. Imaging techniques for measuring adipose-tissue distribution in the abdomen: a comparison between computed tomography and 1.5-tesla magnetic resonance spin-echo imaging. Radiat Med 1998; 16: 99-107.
PubMed ID: 9650896
-
Rennie KL, McCarthy N, Yazdgerdi S, et al. Association of the metabolic syndrome with both vigorous and moderate physical activity. Int J Epidemiol 2003; 32: 600-6.
PubMed ID: 12913036
-
Ekelund U, Griffin SJ and Wareham NJ. Physical activity and metabolic risk in individuals with a family history of type 2 diabetes. Diabetes Care 2007; 30: 337-42.
PubMed ID: 17259504
-
Carroll S, Cooke CB and Butterly RJ. Metabolic clustering, physical activity and fitness in nonsmoking, middle-aged men. Med Sci Sports Exerc 2000; 32: 2079-86.
PubMed ID: 11128855
-
Lakka TA, Laaksonen DE, Lakka HM, et al. Sedentary lifestyle, poor cardiorespiratory fitness, and the metabolic syndrome. Med Sci Sports Exerc 2003; 35: 1279-86.
PubMed ID: 12900679
-
Thune I, Njolstad I, Lochen ML, et al. Physical activity improves the metabolic risk profiles in men and women: the Tromso Study. Arch Intern Med 1998; 158: 1633-40.
PubMed ID: 9701097
-
Lemieux I, Pascot A, Lamarche B, et al. Is the gender difference in LDL size explained by the metabolic complications of visceral obesity? Eur J Clin Invest 2002; 32: 909-17.
PubMed ID: 12534450
-
Kanaley JA, Sames C, Swisher L, et al. Abdominal fat distribution in pre- and postmenopausal women: The impact of physical activity, age, and menopausal status. Metabolism 2001; 50: 976-82.
PubMed ID: 11474488
-
Lemieux S, Prud’homme D, Nadeau A, et al. Seven-year changes in body fat and visceral adipose tissue in women. Association with indexes of plasma glucose-insulin homeostasis. Diabetes Care 1996; 19: 983-91.
PubMed ID: 8875093
-
Brochu M, Starling RD, Tchernof A, et al. Visceral adipose tissue is an independent correlate of glucose disposal in older obese postmenopausal women. J Clin Endocrinol Metab 2000; 85: 2378-84.
PubMed ID: 10902782
-
Hayashi T, Boyko EJ, Leonetti DL, et al. Visceral adiposity is an independent predictor of incident hypertension in Japanese Americans. Ann Intern Med 2004; 140: 992-1000.
PubMed ID: 15197016
-
Fujimoto WY, Bergstrom RW, Boyko EJ, et al. Visceral adiposity and incident coronary heart disease in Japanese-American men. The 10-year follow-up results of the Seattle Japanese-American Community Diabetes Study. Diabetes Care 1999; 22: 1808-12.
PubMed ID: 10546012
-
Boyko EJ, Fujimoto WY, Leonetti DL, et al. Visceral adiposity and risk of type 2 diabetes: a prospective study among Japanese Americans. Diabetes Care 2000; 23: 465-71.
PubMed ID: 10857936
-
Kuk JL, Katzmarzyk PT, Nichaman MZ, et al. Visceral fat is an independent predictor of all-cause mortality in men. Obesity (Silver Spring) 2006; 14: 336-41.
PubMed ID: 16571861
-
Neeland IJ, Ross, R, Després JP, et al. Visceral and ectopic fat, atherosclerosis, and cardiometabolic disease: a position statement. Lancet Diabetes Endocrinol 2019; 7: 715-25.
PubMed ID: 31301983
-
Ross R, Neeland IJ, Yamashita S, et al. Waist circumference as a vital sign in clinical practice: a Consensus Statement from the IAS and ICCR Working Group on Visceral Obesity. Nat Rev Endocrinol 2020; 16: 177-89.
PubMed ID: 32020062
-
Kovanlikaya A, Mittelman SD, Ward A, et al. Obesity and fat quantification in lean tissues using three-point Dixon MR imaging. Pediatr Radiol 2005; 35: 601-7.
PubMed ID: 15785930
-
Marks SJ, Moore NR, Ryley NG, et al. Measurement of liver fat by MRI and its reduction by dexfenfluramine in NIDDM. Int J Obes Relat Metab Disord 1997; 21: 274-9.
PubMed ID: 9130023
-
Schick F, Machann J, Brechtel K, et al. MRI of muscular fat. Magn Reson Med 2002; 47: 720-7.
PubMed ID: 11948733
-
Fishbein M, Castro F, Cheruku S, et al. Hepatic MRI for fat quantitation: its relationship to fat morphology, diagnosis, and ultrasound. J Clin Gastroenterol 2005; 39: 619-25.
PubMed ID: 16000931
 CLOSE
CLOSE
CLOSE
CLOSE
Ross R, Goodpaster B, Kelley D, et al. Magnetic resonance imaging in human body composition research. From quantitative to qualitative tissue measurement. Ann N Y Acad Sci 2000; 904: 12-7.
PubMed ID: 10865704CLOSE
Ross R, Rissanen J, Pedwell H, et al. Influence of diet and exercise on skeletal muscle and visceral adipose tissue in men. J Appl Physiol 1996; 81: 2445-55.
PubMed ID: 9018491CLOSE
Ross R. Magnetic resonance imaging provides new insights into the characterization of adipose and lean tissue distribution. Can J Physiol Pharmacol 1996; 74: 778-85.
PubMed ID: 8909791CLOSE
Thomas EL, Saeed N, Hajnal JV, et al. Magnetic resonance imaging of total body fat. J Appl Physiol 1998; 85: 1778-85.
PubMed ID: 9804581CLOSE
Ross R, Léger L, Morris D, et al. Quantification of adipose tissue by MRI: relationship with anthropometric variables. J Appl Physiol 1992; 72: 787-95.
PubMed ID: 1559959CLOSE
Abate N, Burns D, Peshock RM, et al. Estimation of adipose tissue mass by magnetic resonance imaging: validation against dissection in human cadavers. J Lipid Res 1994; 35: 1490-6.
PubMed ID: 7989873CLOSE
Kvist H, Sjostrom L and Tylen U. Adipose tissue volume determinations in women by computed tomography: technical considerations. Int J Obes 1986; 10: 53-67.
PubMed ID: 3710689CLOSE
Shen W, Wang Z, Tang H, et al. Volume estimates by imaging methods: model comparisons with visible woman as the reference. Obes Res 2003; 11: 217-25.
PubMed ID: 12582217CLOSE
CLOSE
Gallagher D, Belmonte D, Deurenberg P, et al. Organ-tissue mass measurement allows modeling of REE and metabolically active tissue mass. Am J Physiol 1998; 275: E249-58.
PubMed ID: 9688626CLOSE
Hughes VA, Frontera WR, Wood M, et al. Longitudinal muscle strength changes in older adults: influence of muscle mass, physical activity, and health. J Gerontol A Biol Sci Med Sci 2001; 56: B209-17.
PubMed ID: 11320101CLOSE
Newman AB, Haggerty CL, Goodpaster B, et al. Strength and muscle quality in a well-functioning cohort of older adults: the Health, Aging and Body Composition Study. J Am Geriatr Soc 2003; 51: 323-30.
PubMed ID: 12588575CLOSE
Visser M, Goodpaster BH, Kritchevsky SB, et al. Muscle mass, muscle strength, and muscle fat infiltration as predictors of incident mobility limitations in well-functioning older persons. J Gerontol A Biol Sci Med Sci 2005; 60: 324-33.
PubMed ID: 15860469CLOSE
Mitsiopoulos N, Baumgartner RN, Heymsfield SB, et al. Cadaver validation of skeletal muscle measurement by magnetic resonance imaging and computerized tomography. J Appl Physiol 1998; 85: 115-22.
PubMed ID: 9655763CLOSE
Lee SJ, Janssen I, Heymsfield SB, et al. Relation between whole-body and regional measures of human skeletal muscle. Am J Clin Nutr 2004; 80: 1215-21.
PubMed ID: 15531668CLOSE
Seidell JC, Bakker CJ and van der Kooy K. Imaging techniques for measuring adipose-tissue distribution–a comparison between computed tomography and 1.5-T magnetic resonance. Am J Clin Nutr 1990; 51: 953-7.
PubMed ID: 2349931CLOSE
Ohsuzu F, Kosuda S, Takayama E, et al. Imaging techniques for measuring adipose-tissue distribution in the abdomen: a comparison between computed tomography and 1.5-tesla magnetic resonance spin-echo imaging. Radiat Med 1998; 16: 99-107.
PubMed ID: 9650896CLOSE
Rennie KL, McCarthy N, Yazdgerdi S, et al. Association of the metabolic syndrome with both vigorous and moderate physical activity. Int J Epidemiol 2003; 32: 600-6.
PubMed ID: 12913036CLOSE
Ekelund U, Griffin SJ and Wareham NJ. Physical activity and metabolic risk in individuals with a family history of type 2 diabetes. Diabetes Care 2007; 30: 337-42.
PubMed ID: 17259504CLOSE
Carroll S, Cooke CB and Butterly RJ. Metabolic clustering, physical activity and fitness in nonsmoking, middle-aged men. Med Sci Sports Exerc 2000; 32: 2079-86.
PubMed ID: 11128855CLOSE
Lakka TA, Laaksonen DE, Lakka HM, et al. Sedentary lifestyle, poor cardiorespiratory fitness, and the metabolic syndrome. Med Sci Sports Exerc 2003; 35: 1279-86.
PubMed ID: 12900679CLOSE
Thune I, Njolstad I, Lochen ML, et al. Physical activity improves the metabolic risk profiles in men and women: the Tromso Study. Arch Intern Med 1998; 158: 1633-40.
PubMed ID: 9701097CLOSE
Lemieux I, Pascot A, Lamarche B, et al. Is the gender difference in LDL size explained by the metabolic complications of visceral obesity? Eur J Clin Invest 2002; 32: 909-17.
PubMed ID: 12534450CLOSE
Kanaley JA, Sames C, Swisher L, et al. Abdominal fat distribution in pre- and postmenopausal women: The impact of physical activity, age, and menopausal status. Metabolism 2001; 50: 976-82.
PubMed ID: 11474488CLOSE
Lemieux S, Prud’homme D, Nadeau A, et al. Seven-year changes in body fat and visceral adipose tissue in women. Association with indexes of plasma glucose-insulin homeostasis. Diabetes Care 1996; 19: 983-91.
PubMed ID: 8875093CLOSE
Brochu M, Starling RD, Tchernof A, et al. Visceral adipose tissue is an independent correlate of glucose disposal in older obese postmenopausal women. J Clin Endocrinol Metab 2000; 85: 2378-84.
PubMed ID: 10902782CLOSE
Hayashi T, Boyko EJ, Leonetti DL, et al. Visceral adiposity is an independent predictor of incident hypertension in Japanese Americans. Ann Intern Med 2004; 140: 992-1000.
PubMed ID: 15197016CLOSE
Fujimoto WY, Bergstrom RW, Boyko EJ, et al. Visceral adiposity and incident coronary heart disease in Japanese-American men. The 10-year follow-up results of the Seattle Japanese-American Community Diabetes Study. Diabetes Care 1999; 22: 1808-12.
PubMed ID: 10546012CLOSE
Boyko EJ, Fujimoto WY, Leonetti DL, et al. Visceral adiposity and risk of type 2 diabetes: a prospective study among Japanese Americans. Diabetes Care 2000; 23: 465-71.
PubMed ID: 10857936CLOSE
Kuk JL, Katzmarzyk PT, Nichaman MZ, et al. Visceral fat is an independent predictor of all-cause mortality in men. Obesity (Silver Spring) 2006; 14: 336-41.
PubMed ID: 16571861CLOSE
Neeland IJ, Ross, R, Després JP, et al. Visceral and ectopic fat, atherosclerosis, and cardiometabolic disease: a position statement. Lancet Diabetes Endocrinol 2019; 7: 715-25.
PubMed ID: 31301983CLOSE
Ross R, Neeland IJ, Yamashita S, et al. Waist circumference as a vital sign in clinical practice: a Consensus Statement from the IAS and ICCR Working Group on Visceral Obesity. Nat Rev Endocrinol 2020; 16: 177-89.
PubMed ID: 32020062CLOSE
Kovanlikaya A, Mittelman SD, Ward A, et al. Obesity and fat quantification in lean tissues using three-point Dixon MR imaging. Pediatr Radiol 2005; 35: 601-7.
PubMed ID: 15785930CLOSE
Marks SJ, Moore NR, Ryley NG, et al. Measurement of liver fat by MRI and its reduction by dexfenfluramine in NIDDM. Int J Obes Relat Metab Disord 1997; 21: 274-9.
PubMed ID: 9130023CLOSE
Schick F, Machann J, Brechtel K, et al. MRI of muscular fat. Magn Reson Med 2002; 47: 720-7.
PubMed ID: 11948733CLOSE
Fishbein M, Castro F, Cheruku S, et al. Hepatic MRI for fat quantitation: its relationship to fat morphology, diagnosis, and ultrasound. J Clin Gastroenterol 2005; 39: 619-25.
PubMed ID: 16000931